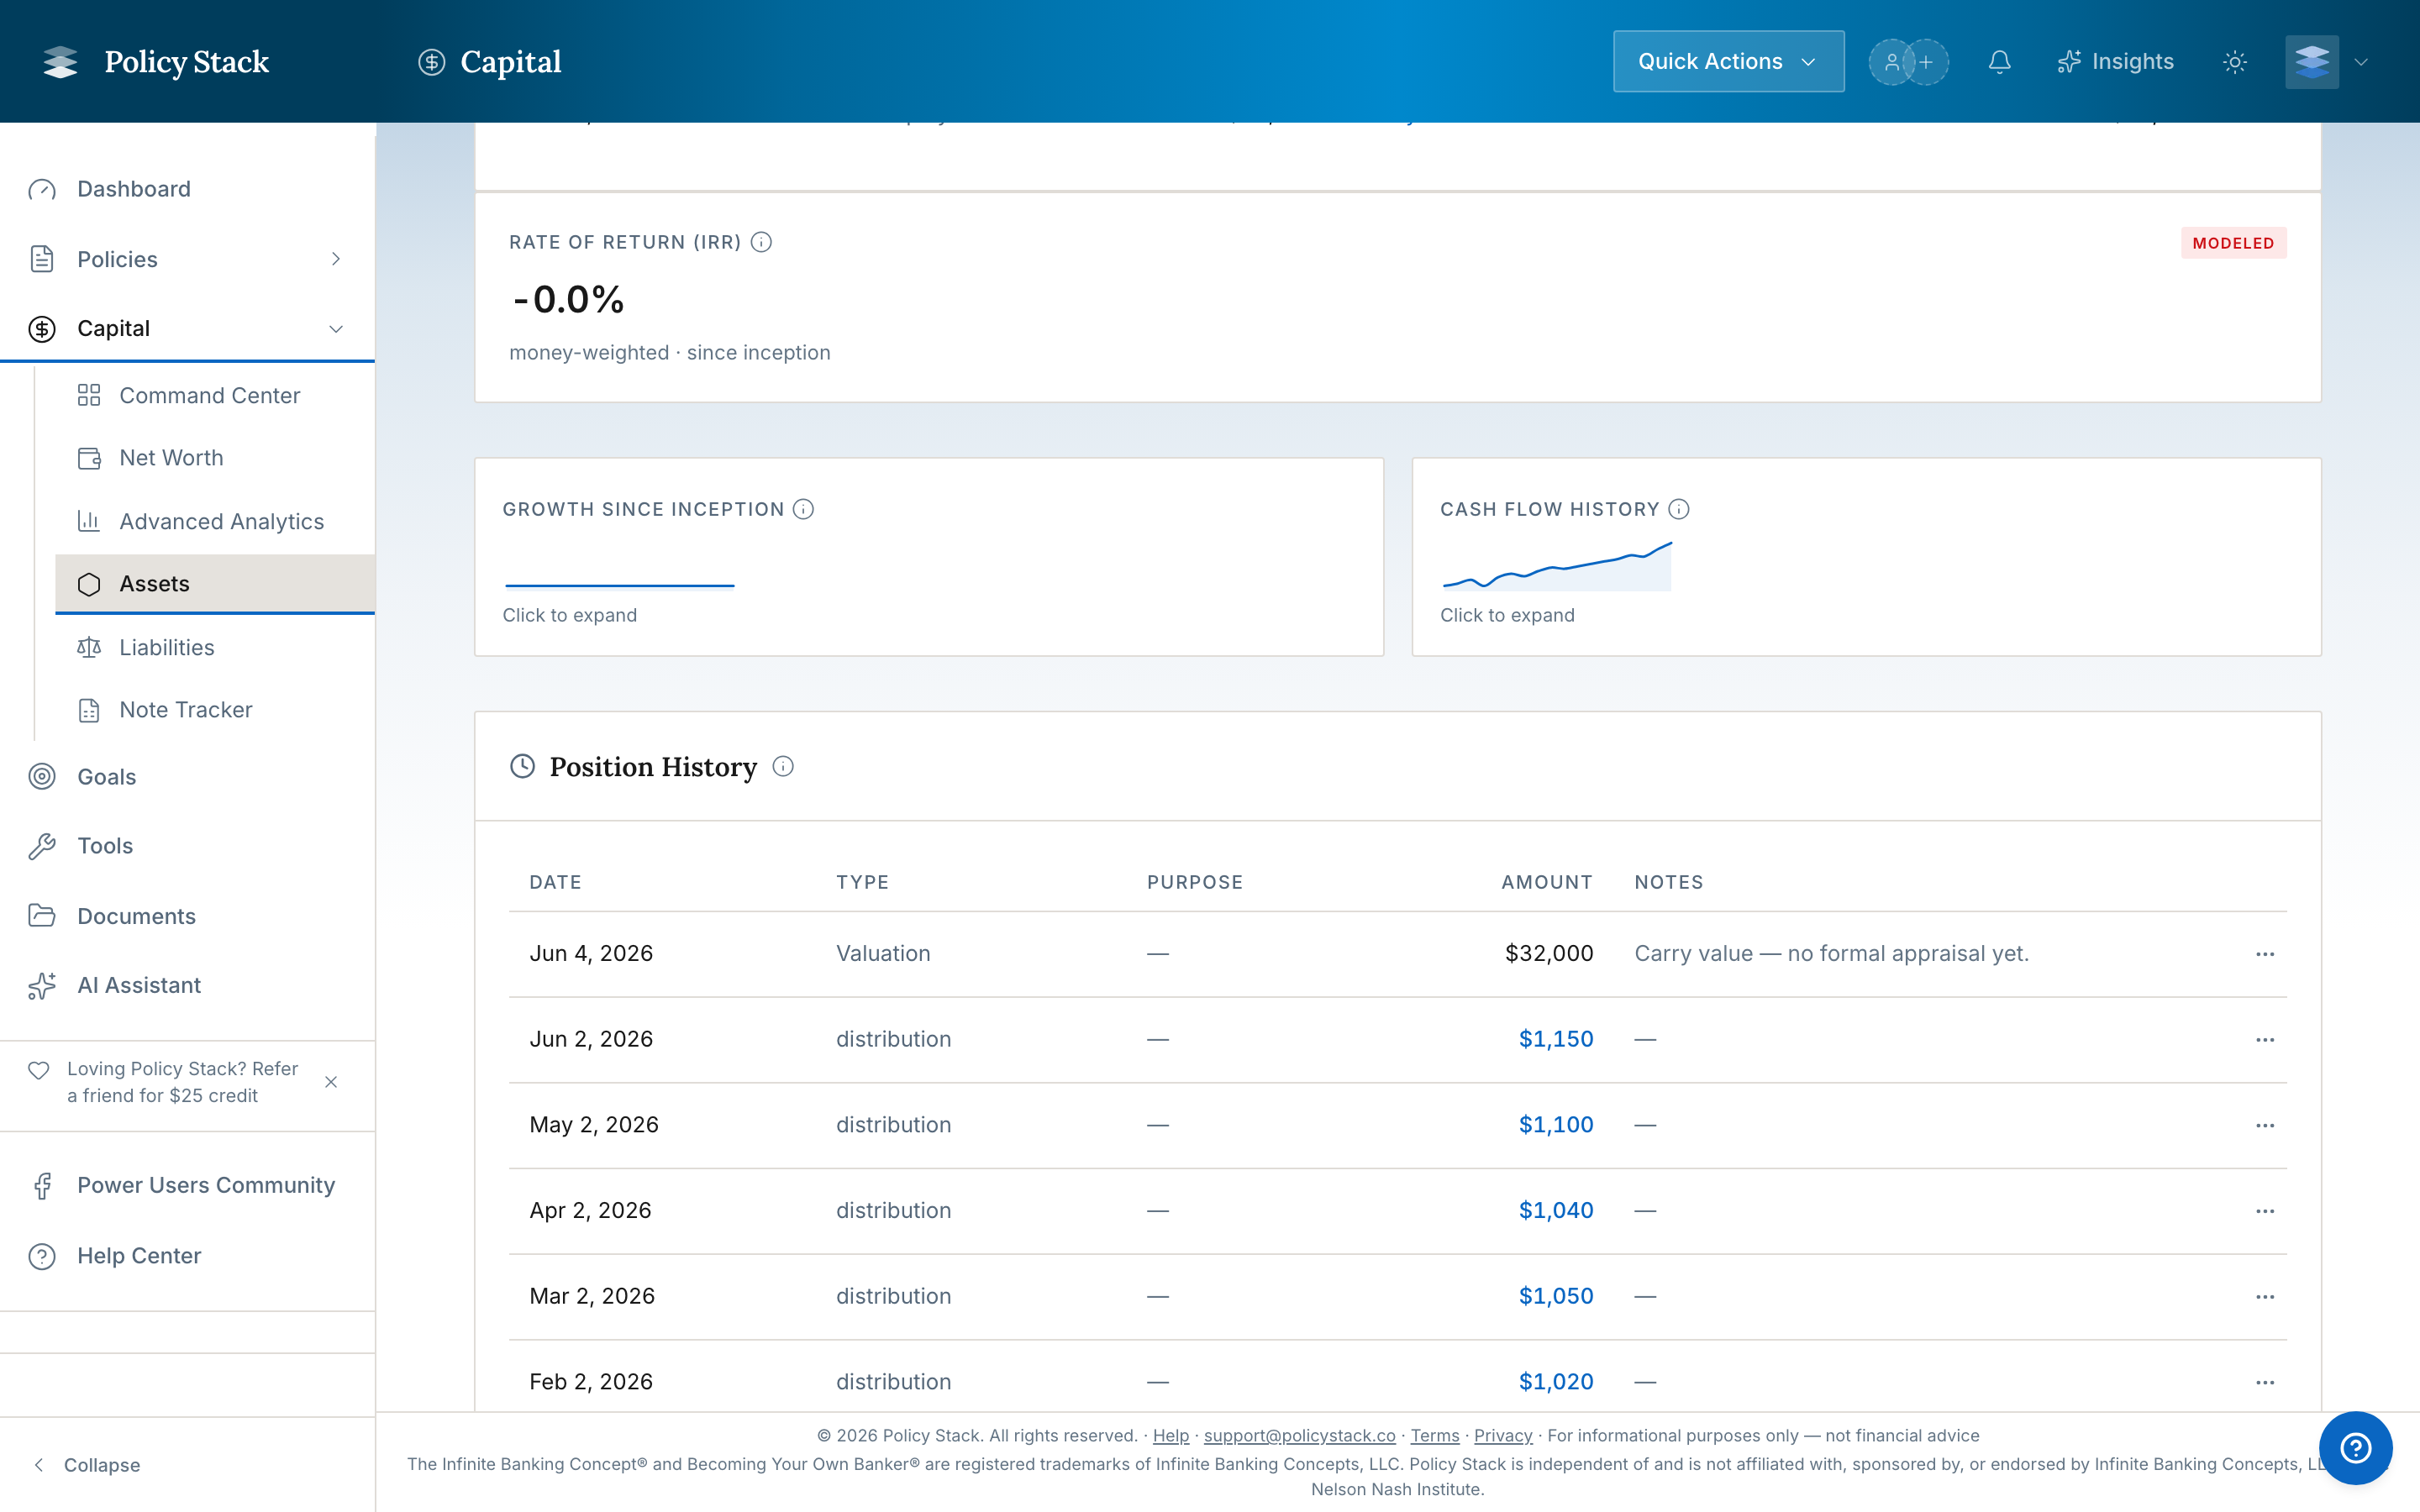
Each asset detail page can show a Rate of Return (IRR) and a Growth Since Inception chart, so you can see how an asset has performed using the capital events and valuations you have recorded.
Rate of Return (IRR)
The Rate of Return is a money-weighted return (IRR). It accounts for the timing and size of every capital event — when you put money in, when income or principal came back — not just the start and end values. This makes it a fairer measure than a simple percentage when capital flows in and out at different times.
Policy Stack shows the Rate of Return only when it is reliable: there is at least one recorded valuation, the math converges to a real number, and the cash-flow history spans at least 30 days. Until then, the asset shows its recorded values without an IRR figure.
Growth Since Inception
"Inception" is the earliest capital-in event for the asset — the first time you deployed capital into it, not the first snapshot you happened to record. The Growth chart plots the asset's recorded market value against the cumulative capital you have contributed, so the gap between the two lines is the growth.
Reading It Alongside Spread
Spread compares an asset's return rate to the policy-loan rate that funded it. When a reliable IRR is available, it reflects realized performance and is the more complete picture. Policy Stack shows these as recorded measurements, not projections or advice.